· Rudraveer · 4 min read
How TV Dashboards Make Data More Visible and Actionable

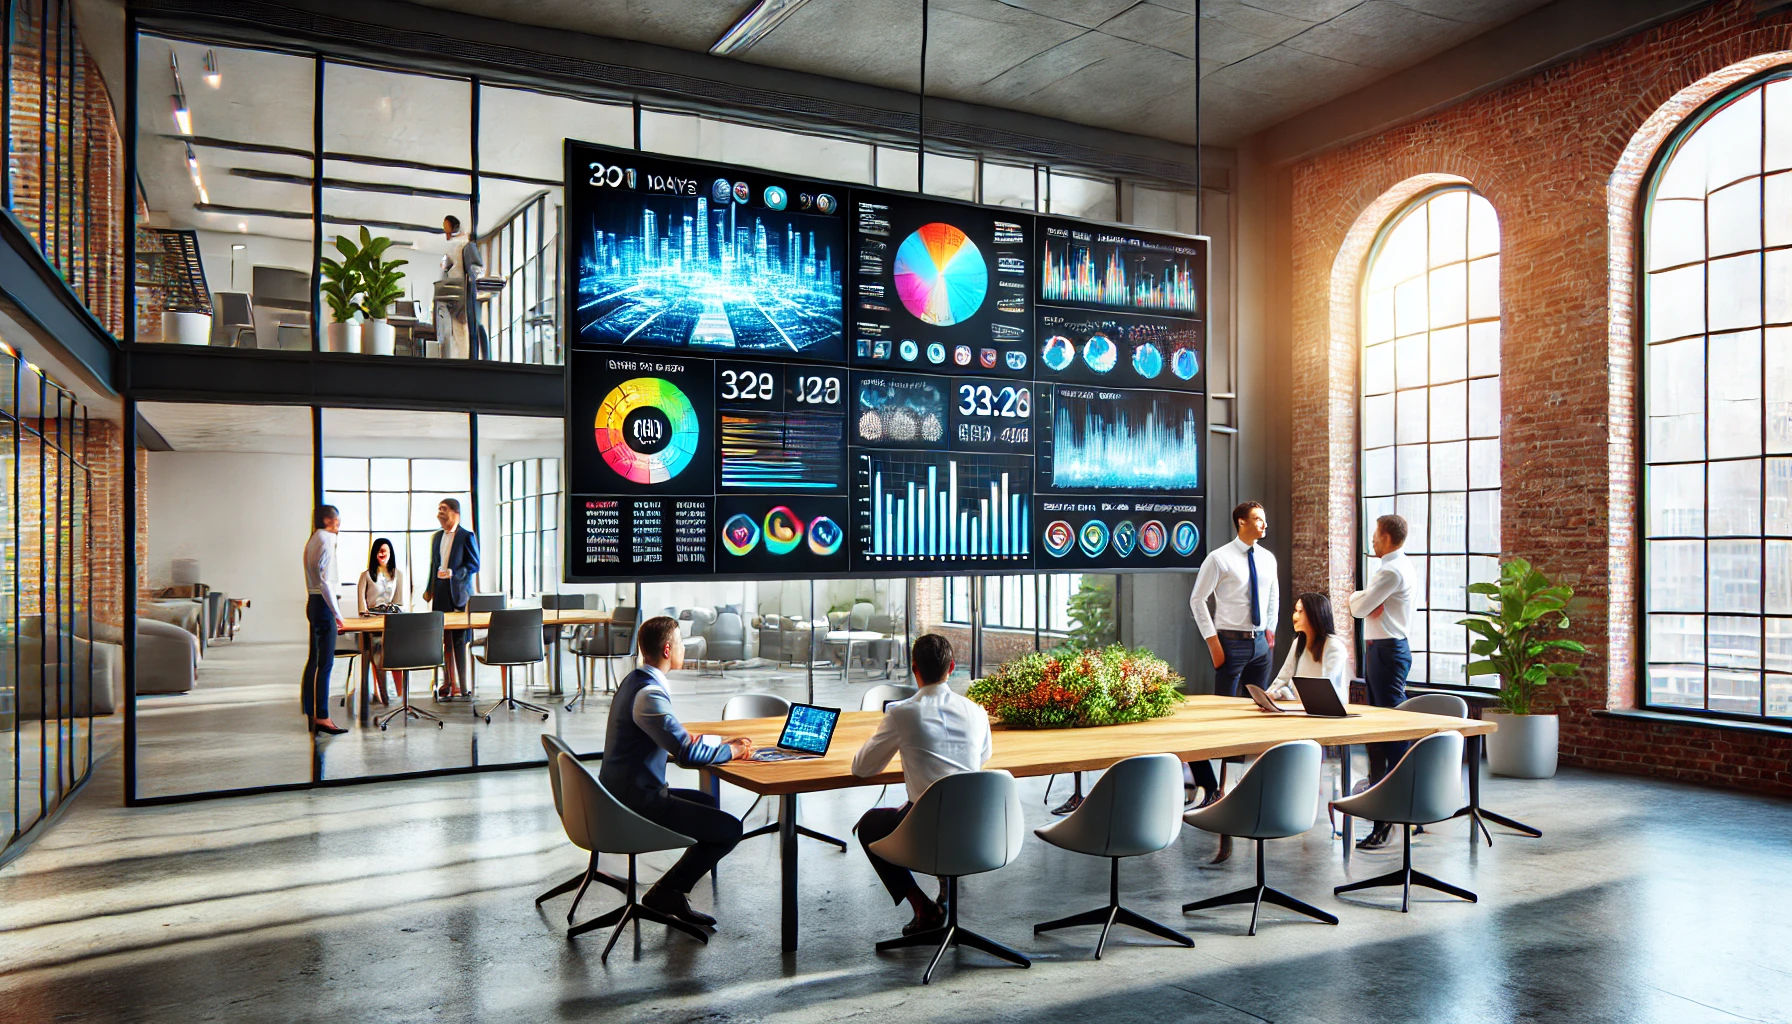
The way we communicate and share information makes or breaks its impact. While data and information are crucially important in today’s business scenario, how we present that data also matters. Imagine your workplace displaying current stats, metrics, upcoming goals, and milestones vividly as you walk in. That’s the power of TV dashboards.
These sleek, dynamic, and visually appealing screens aren’t limited to businesses and teams; they elevate communication across industries. So, what are TV dashboards, and how can you set one up? Let’s dive in.
What is a TV Dashboard?
TV dashboards, also known as wallboards, are large-screen displays that showcase key performance indicators (KPIs) and statistical data in real-time. Unlike traditional dashboards confined to personal devices, TV dashboards ensure team-wide visibility, promoting accessibility and actionable insights.
For example, a sales team can track daily targets alongside performance metrics on a shared screen. Similarly, warehouse management teams can monitor inventory metrics in real-time.
Benefits of TV Dashboards
1. Track & Monitor Data Effortlessly in Real-Time
TV dashboards update data in real-time, eliminating the need for manual tracking. Teams can respond to sudden changes swiftly, with no need for individual logins. This fosters better decision-making and efficiency.
2. Make Data More Accessible & Actionable
By displaying project timelines or live sales figures prominently, TV dashboards empower teams to act instantly. Crucial stats remain visible, allowing trends to be spotted and opportunities seized without delay.
3. Improve Transparency & Communication
TV dashboards enhance team alignment by ensuring everyone has access to the same information. This fosters transparency, bridges communication gaps, and creates a collaborative workplace.
4. Boost Performance
Visual data motivates teams. Tracking progress against goals on a shared screen drives accountability and performance. For example, sales teams tracking daily targets are more likely to meet or exceed them.
Use Cases of TV Dashboards
1. Corporate Offices
In corporate settings, TV dashboards track team performance and project milestones. They provide real-time insights into metrics such as lead conversion rates and task statuses, enabling streamlined operations.
2. Retail & E-Commerce
Retailers and e-commerce platforms use TV dashboards to monitor sales figures, inventory, and logistics. Displaying customer feedback or loyalty program stats can also enhance the shopping experience.
3. Manufacturing & Logistics
In manufacturing and logistics, TV dashboards monitor equipment utilization, supplier performance, and shipment statuses. They enable quick responses to disruptions, optimizing workflows.
4. Healthcare
Healthcare facilities use TV dashboards to display real-time bed availability, patient wait times, and staff schedules. This streamlines operations and enhances patient care.
Setting Up Your TV Dashboard
Here’s a step-by-step guide:
1. Selecting the Software
Choose a TV dashboard software that integrates seamlessly with your existing data sources and supports real-time updates. Ensure it allows remote management and dynamic displays.
2. Choosing the Hardware
Select a high-quality TV or monitor with HD or 4K resolution. For long-term use, opt for commercial-grade displays like SOC (System-on-Chip).
3. Connect Your Data Sources
Identify the KPIs and data sources to display, such as CRM analytics or operational metrics. Ensure your software supports these integrations for accurate, real-time data visualization.
4. Setup the Display Connection
Connect your TV to the dashboard software using:
- Streaming devices (e.g., Chromecast, Fire Stick)
- Direct connections via a media box
- Cloud-based options for smart TVs
5. Customize Your Dashboard Layout
Design a clean, visually appealing layout prioritizing critical KPIs. Use charts and graphs to enhance readability. Keep the design simple and aligned with your brand.
6. Test and Adjust
Test the setup for readability and functionality. Automate data refresh and gather feedback to fine-tune the display for maximum impact.
Using Digital Signage Software for TV Dashboards
If you already have digital signage screens, you can repurpose them as TV dashboards. Digital signage software offers:
Ease of Integration
Seamlessly connect with tools like Google Analytics or Power BI to display real-time data visually.
Customizable Display Options
Create dynamic layouts and add brand visuals to align with your organization’s identity.
Remote Management
Manage multiple dashboards from a single platform, ideal for distributed teams or retail chains.
Why Choose Flickerwall?
Flickerwall simplifies TV dashboard creation. With robust integrations and intuitive features, you can showcase Power BI stats, KPIs, and analytics on large screens in minutes. Learn how Flickerwall can help you turn data into actionable insights.
👉 Start Your Free Trial Now
No credit card required. Instant access. Risk-free.

